FY 2006 Risk Methodology Overview
·
The FY 2006 DHS risk methodology represents a major step forward
in the analysis of the risk of terrorism faced by our Nations communities.
Tremendous gains have been made in both the quality and specificity of
information and analysis incorporated within the model, yielding the most
accurate estimation possible of the relative risk of prospective grant
candidates. The methodology is designed to inform a policy decision regarding
the allocation and investment of Federal grant funding, and should not be
confused with an estimate of absolute risk faced by candidate
areas.
·
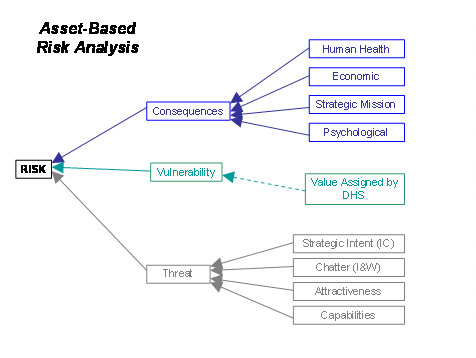
In the FY 2006 model, risk is treated as a function of three
variables:
·
Threat, or the likelihood of a type of attack that might be
attempted
·
Vulnerability, or the likelihood that an attacker would succeed
·
Consequence, or the impact of an attack occurring
·
Fundamentally, the FY 2006 methodology addresses two separate,
but complementary, types of risk: asset-based risk and
geographically-based risk. Considered together, these two
calculations provide an estimate of total terrorism risk, evaluating both
risks to assets as well as risk to populations and geographic areas. This is
accomplished using a common, scalable risk model that is internally consistent
across all homeland security grants in FY 2006, supporting DHS broader
objective of achieving consistency in national risk management efforts.
Calculating Risk
·
Asset-based risk is a function of the risk of terrorism
to potential targets within a geographic area. It accounts for the combined
risks associated with the various types of
assets within the footprint of each individual grant candidate. (Footprints
for grant candidates were defined as follows: state boundary for States;
combined city limits plus 10-mile buffer for Urban Areas; commercial waterway
plus 2-mile buffer for ports.) Asset-based risk allows DHS to strategically
evaluate the likelihood of a terrorist attack against assets based on
Intelligence Community assessments and the consequences that attack could
have.
Asset-based Risk =
Total consequence of the loss of a particular asset type given a specific
attack mode
x
Vulnerability of a particular asset type given a specific attack mode
x
Combined intent and capability of an adversary to utilize a specific mode of
attack
·
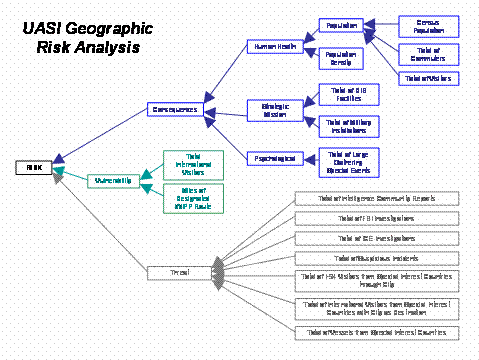
Geographically-based risk
is derived from certain prevailing attributes or characteristics intrinsic to
a geographical area that may contribute to its risk of terrorism. This
approach incorporates types of threat data that are independent of a specific,
identifiable asset, such as reports on possible threatening activities within
a given geographic area. Similarly, through this approach, DHS can consider
variables such as population or general characteristics such as a border that
are not linked to one particular type of asset.
Geographically-based Risk =
Consequences derived from geographic attributes of the candidate area
x
Vulnerability attributes of the candidate area
x
Threat related to the candidate area
Enhancements to the FY 2006 Risk Analysis Process
·
Significant enhancements have been incorporated into the FY 2006
risk analysis process, including:
·
The development of a common and scalable risk model,
·
Greater depth and breadth in infrastructure data,
·
Improved attribution of threat and law enforcement activity
data,
·
The incorporation of strategic threat analysis from Intelligence
Community products,
·
The inclusion of urbanized areas outside official city limits in
order to better encourage regionalization, and
·
The incorporation of transient populations, such as tourists and
commuters.
·
In FY 2006, DHS has taken a major step forward in its risk
analysis, developing a robust model which evaluates both risks to assets as
well as risk to populations and geographic areas.
·
The formula has progressed from a simple count of high and
low criticality and numbers of threat reports in FY 2003 to a fully
risk-based computation that is attack-scenario based and uses
infrastructure-specific vulnerability and consequence estimates.
·
At the same time, DHS has expanded the number of infrastructure
types considered in the analysis from 14 in FY 2003 to 38 in FY 2006. The FY
2006 approach evaluates risk to well over 120,000 specific infrastructures; it
also incorporates strategic threat analysis from the Intelligence Community
along with law enforcement investigations, credible and less-credible threat
reports, and suspicious incident reporting received from local, State and
other Federal agencies.
·
The levels of complexity of the formula and data calculations
have likewise increased markedly from FY 2003 to FY 2006. For example, in FY
2003, three primary equations were used in the risk analysis; in FY 2006, over
4,100 equations were used. For FY 2003, approximately 1,500 calculations were
made, in contrast to more than 3 billion calculations in FY 2006. FY 2005
UASI formulations were represented within a spreadsheet of about 72,000 cells;
if the FY 2006 UASI calculations could be included in a spreadsheet, it would
contain more than 20 million cells.
·
DHS anticipates additional enhancements during the course of FY
2006 to continue the evolution of the risk methodology. Future focus areas
include developing a more sophisticated understanding of the cascading effects
of attacks and improved data and knowledge.
Stakeholder Feedback and the FY 2006 Risk Methodology
·
In May 2005, DHS hosted a one-day stakeholders meeting in
Washington, D.C. to solicit input and feedback on the FY 2005 risk formula
used to determine eligible Urban Areas and associated funding allocations for
the UASI Program.
·
Attendees included key representatives from 12 States/Urban
Areas, as well as representatives from the National Sheriffs Association,
International Association of Chiefs of Police, International Association of
Emergency Managers, Grand Lodge Fraternal Order of Police, International
Association of Fire Chiefs, and Major Cities Chiefs.
·
All of the recommendations on the risk methodology from the
stakeholders were incorporated into the FY 2006 model.
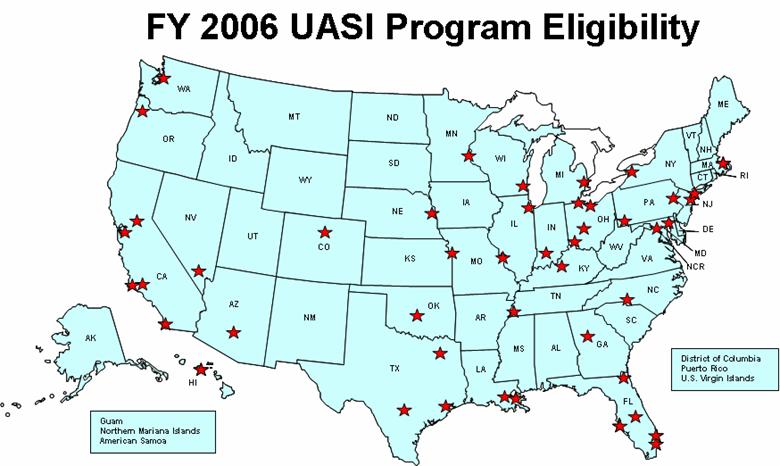
FY 2006 UASI Eligibility
·
The FY 2006 UASI program recognizes the shared nature of risk
across regional metropolitan areas, which both 9/11 and Hurricanes Katrina &
Rita have illustrated, and does a better job of accounting for that in the
risk analysis process. The FY 2006 UASI program also more finely focuses
candidate eligibility while providing broader coverage of critical assets and
populations nationally.
·
To identify jurisdictions for inclusion in the data count phase,
all cities with a population greater than 100,000 and any city with reported
threat data during the past fiscal year were identified. Cities on this list
with shared city boundaries were then combined into a single candidate area. A
10-mile buffer was then drawn from the border of that city or combined
candidate area to establish the geographical area in which data was
evaluated. All candidate areas with a combined population of greater than
200,000 were then considered in the final analysis.
·
The pool of candidates eligible to apply for the FY 2006 UASI
Program represents 46 Urban Areas. These candidate Urban Areas include 121
cities with a population of greater than 100,000 and account for approximately
20% of the population of the United States. In addition, the 46 eligible
Urban Areas in FY 2006 represent 53 of the 57 Urban Areas previously
designated as participants in the program.
·
In FY 2006, the top 35 Urban Areas identified through the risk
analysis were identified as eligible candidates. This included 42 previously
designated Urban Areas.
·
In addition, 11 Urban Areas that participated in the program in
FY 2005 but did not fall within the top 35 Urban Areas in the FY 2006 risk
analysis have been extended eligibility for one additional grant cycle in FY
2006. This extended eligibility reflects feedback to DHS from stakeholders on
the criticality of providing sustainment funding to existing Urban Areas
across fiscal years. This innovation in Urban Area eligibility determination
provides greater transparency in the process and fosters enhanced long-term
planning for Urban Areas participating in the program.
·
Any Urban Area not identified as eligible through the risk
analysis process for two consecutive grant cycles will not be eligible for
continued funding under the UASI program in the second grant cycle; this will
not preclude the Urban Area from future participation in the program should it
be identified as eligible through the risk analysis in a future year. Urban
Areas will continue to be eligible to receive funding from other DHS programs,
including the State Homeland Security Program and the Law Enforcement
Terrorism Prevention Program.
FY 2006 UASI Program
Governance and Administration
·
UASI program participants, not the Federal government, define
the regional groupings that best achieve and sustain risk-based target levels
of capability. This approach provides greater flexibility in defining Urban
Areas in a manner that reflects each areas unique geopolitical realities and
in designing the governance structures that will guide program implementation.
·
The UASI program continues to allow flexibility for each Urban
Area to design a program governance process that supports their specific
requirements and dynamics, while still furthering regional collaboration in
support of the National Preparedness Goal. To that end, each Urban Area is
required to establish an Urban Area Working Group (UAWG) to steer program
implementation. Membership in the UAWG must provide either direct or indirect
representation for all the jurisdictions that comprise the defined Urban
Area.
·
FY 2006 marks a shift in the way UASI funds will be awarded. In
previous years, Urban Areas knew their funding allocations prior to submitting
grant applications. The FY 2006 UASI program addresses need for the first
time as a criterion in determining grant awards. Applicants will be asked to
submit an Investment Justification requesting resources to undertake specific
initiatives that tie to the Urban Area Homeland Security Strategy and the
National Preparedness Goal.
·
Applications will be evaluated by peers and subject matter
experts based on how effectively the proposed solutions address regional areas
of need. Addressing National, State, and regional priorities and reducing
need will serve to mitigate the overall risk facing the Urban Area.
Coordinating risk-reduction measures on a regional basis strengthens
collective defenses. Jurisdictions that share risk can prepare more
efficiently, and respond more effectively through development of
interconnected and complementary systems.
VISIUAL
REPRESENTATION OF FY 2006 UASI RISK MODEL